
⛳ Palma De Mallorca, Majorca is situated in or near the warm temperate thorn steppe biome.
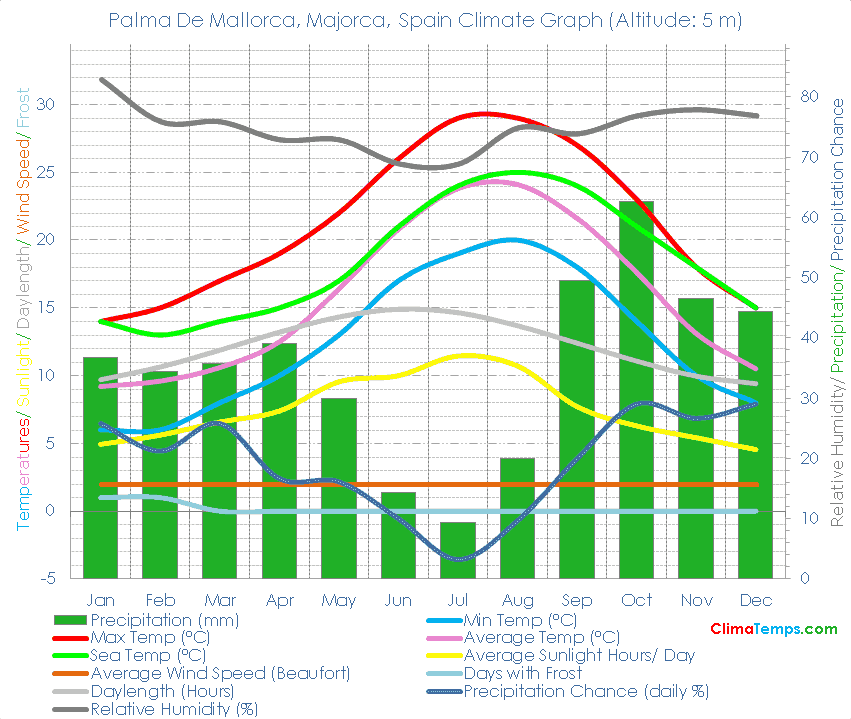
🌡️ The average annual temperature is 15.8 degrees Celsius (60.5 degrees Fahrenheit). See the temperatures page for a monthly breakdown and the fixed scale graph.
🐬 Average monthly temperatures vary by 14.9 °C (26.8°F). This indicates that the continentality type is oceanic, subtype truly oceanic.
☔ Total annual precipitation averages 422.7 mm (16.6 inches) which is equivalent to 422.7 Litres/m² (10.37 Gallons/ft²).
Simply paste the following HTML code into your webpage. Please include a link back to this website. There is one in the following code already. Edit the width attribute to change the size of the graph if needed:
✨ The longest day of the year is 14:47 long on the 22 of June and the shortest day is 9:12 long on the 21 of December.
🌞 On average there are 2796 hours of sunshine per year. Visit the sunshine and daylight section to check monthly details including how high in the sky the sun reaches each month.
🐇Were you to burrow down through the centre of the Earth from Palma De Mallorca, Majorca you would pop up nearest to the climate station at Mokairau, Pakarae, New Zealand (Warm temperate thorn steppe biome).
🌍Palma De Mallorca, Majorca, Spain is at 39°33'N, 2°44'E, 5 m (16 ft). Check the location on the map.
| Climate Variable | Jan | Feb | Mar | Apr | May | Jun | Jul | Aug | Sep | Oct | Nov | Dec | Annual | ||
|---|---|---|---|---|---|---|---|---|---|---|---|---|---|---|---|
| Average Max Temperature °C ( °F) | 14 (57) | 15 (59) | 17 (63) | 19 (66) | 22 (72) | 26 (79) | 29 (84) | 29 (84) | 27 (81) | 23 (73) | 18 (64) | 15 (59) | 21 (70) | ||
| Average Temperature °C ( °F) | 9 (49) | 10 (49) | 11 (51) | 13 (55) | 16 (62) | 21 (69) | 24 (75) | 24 (75) | 22 (71) | 18 (64) | 13 (56) | 11 (51) | 16 (60) | ||
| Average Min Temperature °C ( °F) | 6 (43) | 6 (43) | 8 (46) | 10 (50) | 13 (55) | 17 (63) | 19 (66) | 20 (68) | 18 (64) | 14 (57) | 10 (50) | 8 (46) | 12 (54) | ||
| Average Precipitation mm (in) | 37 (1) | 35 (1) | 36 (1) | 39 (2) | 30 (1) | 14 (1) | 9 (0) | 20 (1) | 50 (2) | 63 (2) | 47 (2) | 44 (2) | 423 (17) | ||
| Number of Wet Days (probability of rain on a day %) | 8 (26) | 6 (21) | 8 (26) | 5 (17) | 5 (16) | 3 (10) | 1 (3) | 3 (10) | 6 (20) | 9 (29) | 8 (27) | 9 (29) | 71 (19) | ||
| Average Sunlight Hours/ Day | 4h 56' | 6h 09' | 6h 34' | 7h 38' | 9h 32' | 10h 20' | 11h 27' | 10h 42' | 7h 58' | 6h 17' | 5h 36' | 4h 32' | 7h 39' | ||
| Average Daylight Hours/ Day | 9h 42' | 10h 38' | 11h 52' | 13h 12' | 14h 19' | 14h 54' | 14h 38' | 13h 40' | 12h 23' | 11h 04' | 9h 57' | 9h 24' | 12h 00' | ||
| Percentage of Sunny (Cloudy) Daylight Hours | 52 (48) | 59 (41) | 56 (44) | 58 (42) | 67 (33) | 70 (30) | 79 (21) | 79 (21) | 65 (35) | 58 (42) | 57 (43) | 49 (51) | 64 (36) | ||
| Sun altitude at solar noon on the 21st day (°). | 30.6 | 39.9 | 50.7 | 62.4 | 70.7 | 73.9 | 70.8 | 62.5 | 51 | 39.6 | 30.4 | 27 | 50.7 |
Please take a moment to share a climate graph or simply the address:
Thank You, so much! ❤️